Monday 22 June 2015

What is Time trend and how to interpret?


In any long time-series, simple time trend can be added as independent variable.

Y = a + bX + cTrend + error


Here, trend is taking a value from 1 to T (total no. of observations in our sample). If c is coming to be significant, it can be inferred that Y is changing with change in time, in addition with independent variable X. The coefficient of Trend (here c) indicates change in dependent variable (Y) with one unit change in time. It gives direction of dependent variable over the time.
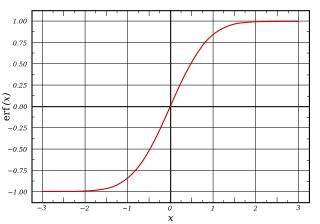
How to do regression when dependent variable is a proportion or bounded (ranging from 0 to 1)?


If dependent variable is a proportion (ranging from 0 to 1), then your predicted values must be a proportion, logically. Therefore we use logit transformation of dependent. Before we proceed further we need to know some terms:
  1. Ogive/ sigmoidal/ flattened S-curve: It is linear in middle part, but categorical on extremes
     
  2. Logit transformation: If your dependent variable is ranging from 0 to 1, e.g. any proportion, then use logit transformation. For Example: If x is dependent then logit transformation is ln(x/(1-x)).


If most of the dependent values are ranging in middle linear part of the curve (from 0.3 to 0.7), we can use simple OLS instead of logistic regression. (http://www.theanalysisfactor.com/proportions-as-dependent-variable-in-regression-which-type-of-model/)